MSCI World or S&P 500: which one should you choose?

Updated on 23 July 2026
“The S&P 500 always beats the MSCI World.” Investors repeat this claim constantly. The reality is more nuanced.
On paper, the S&P 500 has performed better over the last few decades. But choosing between the two mostly comes down to betting, or not, on the continued dominance of the United States.
Here is the matchup, criterion by criterion, to help you decide.

- The S&P 500 groups 500 American companies; the MSCI World holds about 1,500 companies from 23 developed countries, but still stays 70% American stocks.
- Over 40 years, the S&P 500 returned about 10.5% a year against 8.5% for the MSCI World, a gap that doubles the final capital over the long run.
- The S&P 500 is more concentrated (its top 10 holdings weigh 40% of the index) and shows lower ETF fees.
- The MSCI World brings real geographic diversification and adjusts on its own if another country takes over from the United States.
- Both beat a savings account; many investors hold both rather than choosing one.
What are the MSCI World and the S&P 500?
Two benchmark indices, two philosophies. The S&P 500, created by Standard & Poor's in 1957, groups 500 companies that are 100% American and represents close to 80% of US stock market capitalisation. Its style is concentrated: its top 10 holdings weigh about 40% of the index.
The MSCI World, created by Morgan Stanley Capital International in 1969, totals about 1,500 companies spread across 23 developed countries. Its top 10 holdings weigh only 28%.
But careful: the MSCI World is less international than it looks, with 70% American stocks. And above all, China and India are completely absent from it, because they are emerging countries.
To invest in them, you need to move to the MSCI ACWI (All Country World Index), a broader index covering both developed and emerging countries. One catch: no ACWI ETF is PEA-eligible.
| Criterion | S&P 500 | MSCI World |
|---|---|---|
| Launched | 1957 (Standard & Poor's) | 1969 (MSCI) |
| Number of companies | 500 | About 1,500 |
| Region | United States | 23 developed countries (including 70% US) |
| Weight of top 10 holdings | About 40% | About 28% |
| Average annual return (40 years) | About 10.5% | About 8.5% |
| ETF fees (PEA) | From 0.12%/year | 0.20% to 0.38%/year |
Which one has the better historical track record?
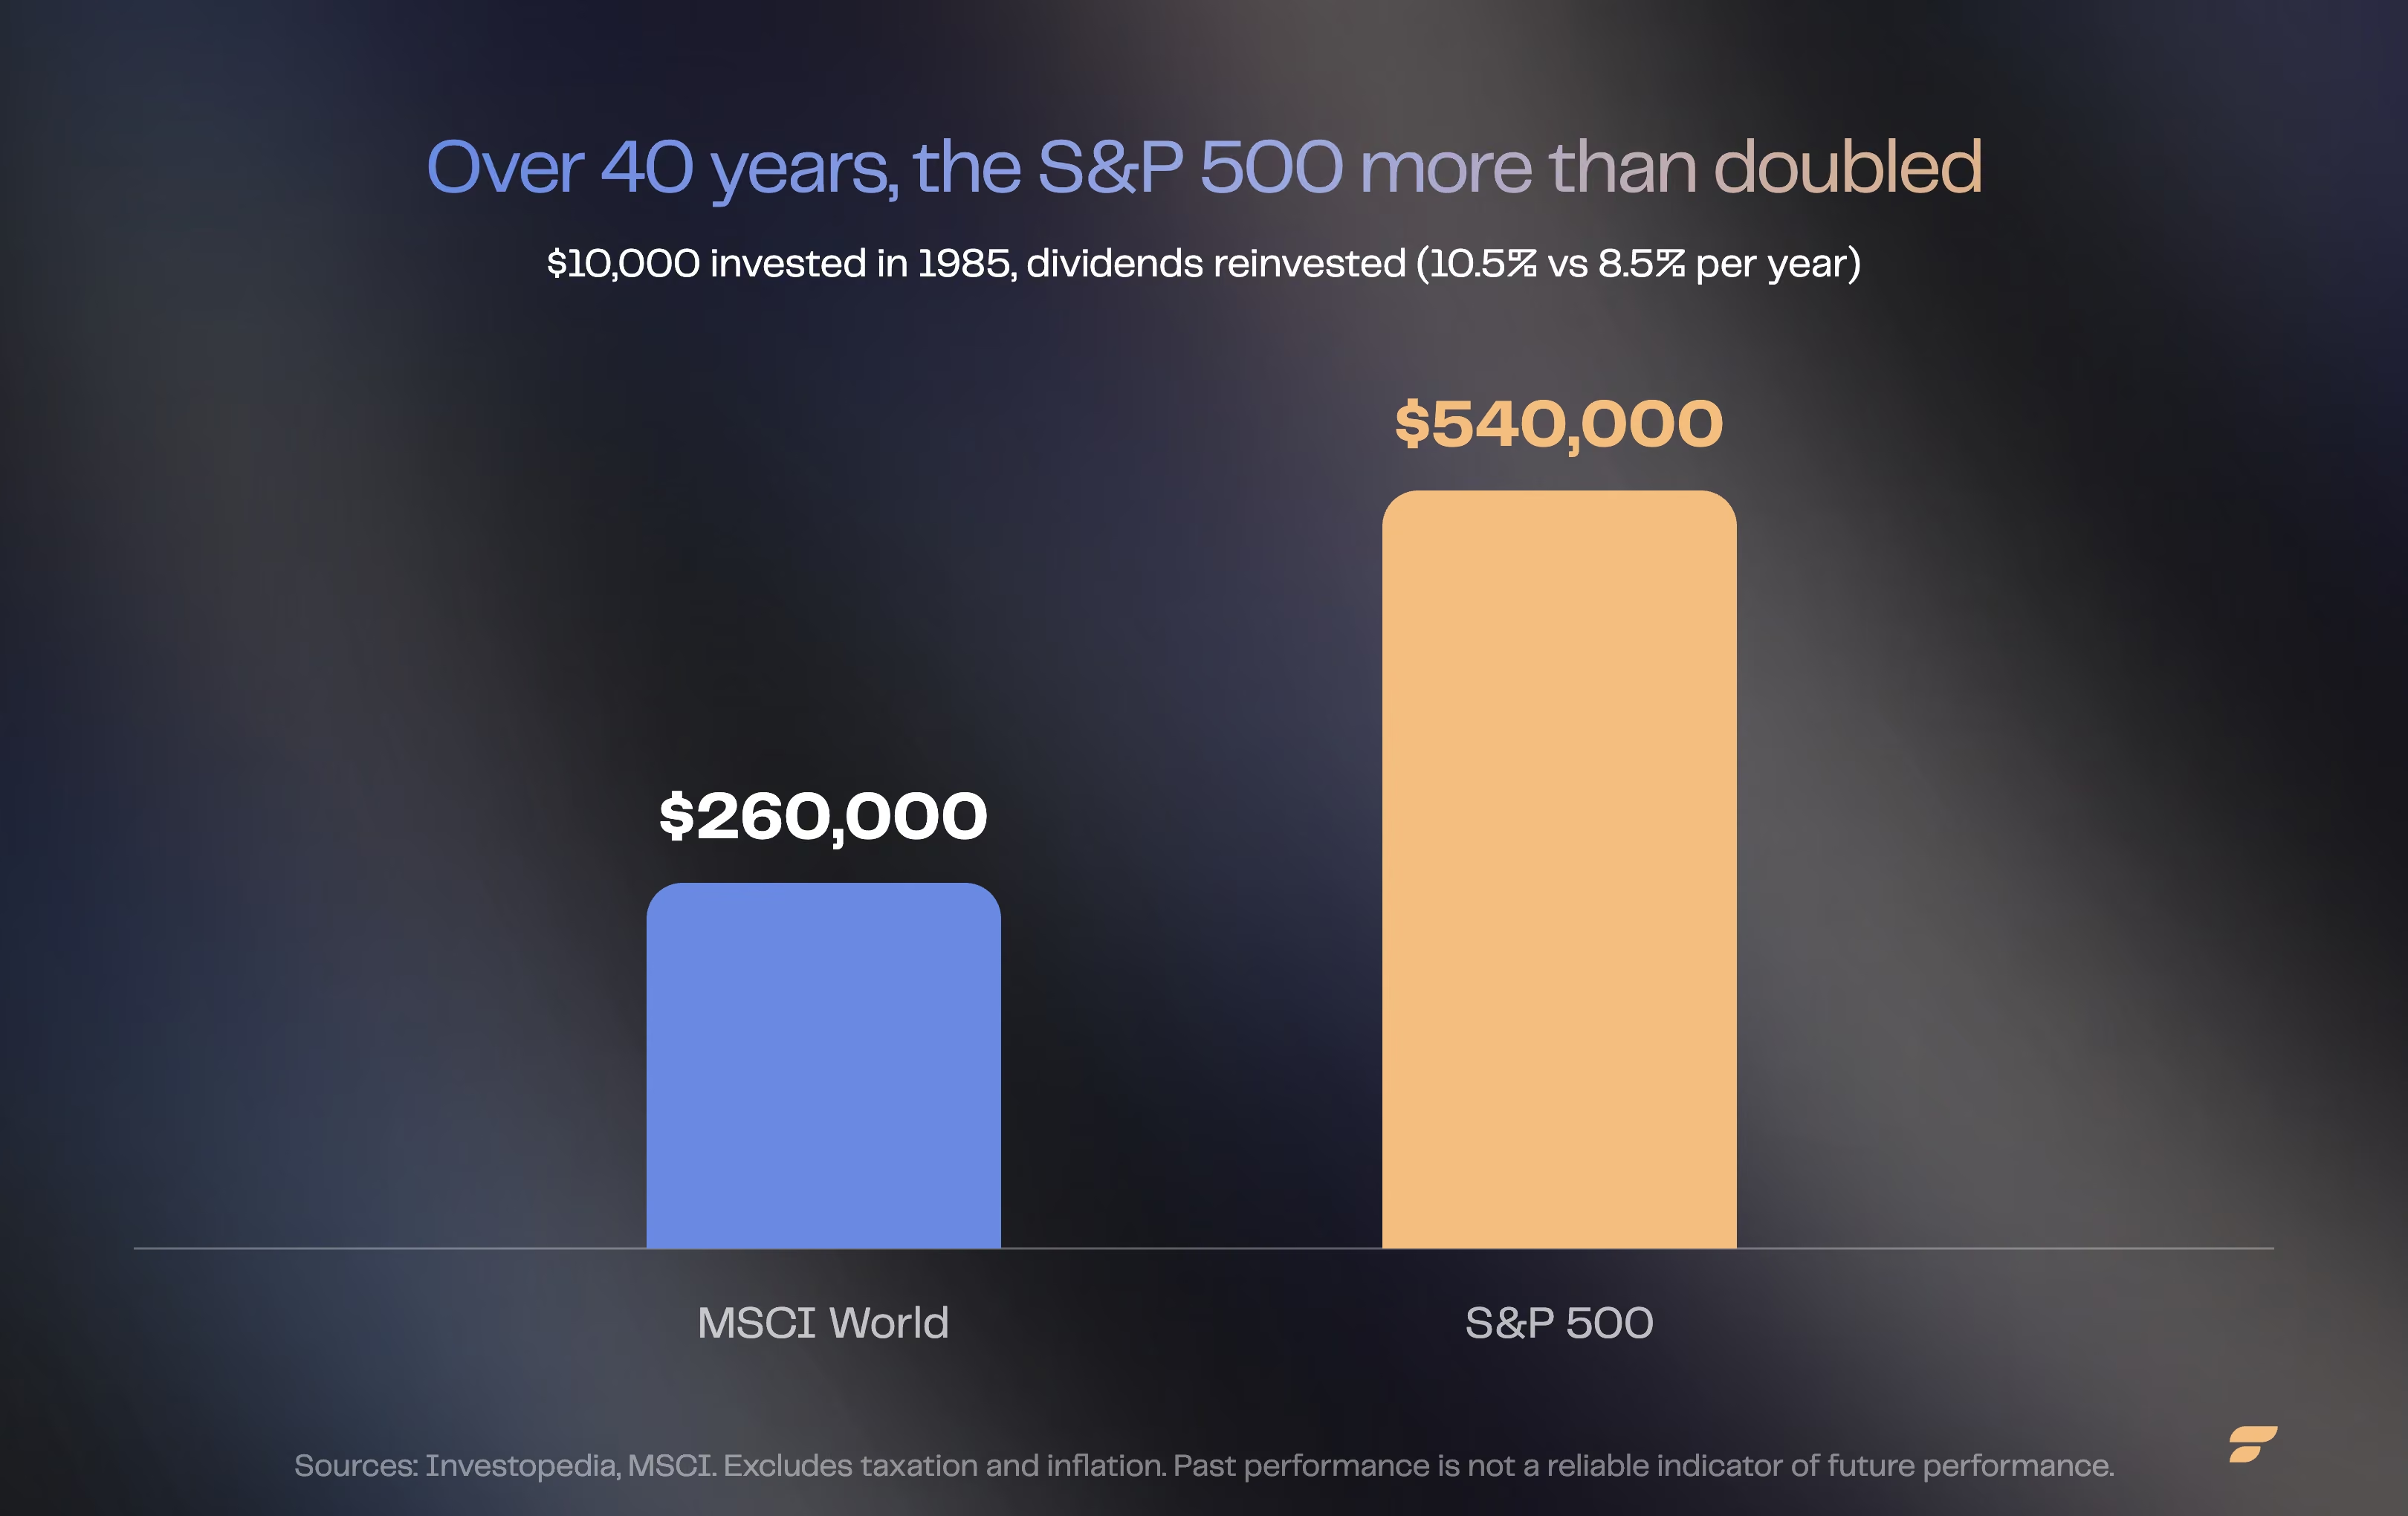
Historically, the S&P 500. Past performance is not a reliable indicator of future performance. Over 40 years, it shows about 10.5% average annual return with dividends reinvested, against 8.5% for the MSCI World, a gap of 2 percentage points.
Two points may look negligible. Yet $10,000 invested in 1985 would have grown to about $260,000 with the MSCI World, against $540,000 with the S&P 500, more than double.
Over the 2010-2020 decade, the gap widens further: +250% for the S&P 500 against +150% for the MSCI World, driven by the GAFAM tech giants. Note that these figures account for neither taxation nor inflation, historically around 2% a year.
What about fees?
Clear advantage to the S&P 500. On a PEA, the Amundi S&P 500 ETF charges 0.12% in fees a year, while the Amundi MSCI World ETF costs between 0.20% (newer share class) and 0.38% a year.
On a securities account, the gap widens: the iShares S&P 500 ETF drops to 0.07%, against 0.20% for the iShares MSCI World, nearly three times more.
These few basis points seem negligible. But over 30 years, with compound interest, they add up to several thousand euros in fees.

Is the MSCI World really more diversified?
Yes geographically, but less than you might think. The S&P 500 only includes companies headquartered in the United States, though they generate 41% of their revenue abroad. The MSCI World adds a genuine international layer: Japan, the United Kingdom, Canada, France, Germany, with companies absent from the S&P 500 such as LVMH, Novo Nordisk or ASML.
But both indices capture globalisation. American multinationals sell everywhere: Microsoft generates 50% of its revenue outside the United States, Apple up to 64%. The S&P 500 therefore benefits from global growth through its revenue, the MSCI World through both its revenue and its structure.
On sectors, the split is nearly identical: healthcare weighs 12% in the MSCI World against 13.4% in the S&P 500, consumer discretionary 12% against 12.7%. The real difference lies in technology, slightly more concentrated in the S&P 500.
This closeness explains one key figure: the correlation between the two indices reaches 0.98. When one rises, the other rises too, and vice versa.
Which one holds up better in crises and currency swings?
The MSCI World's diversification cushions shocks very slightly, but the difference is marginal. In 2008, the subprime crisis originated 100% in the United States; because markets are interconnected, every global index collapsed. Protecting yourself from American risk in a globalised economy remains largely an illusion.
On currency risk, the S&P 500 is denominated in dollars, the MSCI World 70% in dollars and 30% in other currencies. In the short term, the euro-dollar exchange rate creates gaps. But over the long term, studies by Vanguard and BlackRock show that the exchange-rate effect tends to cancel out over 15 to 20 years. It is therefore a secondary criterion for a long-term investor.
MSCI World or S&P 500: which one should you choose?
The matchup is a technical tie: across ten criteria, each wins three times, with four draws. The choice therefore comes down to a single question: will the United States keep dominating the global economy for the next 20 or 30 years?
If your answer is a clear yes, the S&P 500 makes sense: entrepreneurial culture, technological dominance, rock-bottom fees. In exchange, you accept 2 extra points of historical return, at the cost of heavy concentration in the United States.
If you cannot decide, the MSCI World is worth considering. History calls for humility: the United Kingdom accounted for 25% of world market capitalisation in 1900, against about 4% today. Japan seemed unstoppable in 1989, before its index, the Nikkei 225, took 35 years to climb back to its previous peak.
Many investors therefore refuse to choose and hold both, for example 40% MSCI World, 40% S&P 500 and 20% emerging markets. It is also possible to go even broader with the MSCI ACWI (about 3,000 companies, 85% developed countries). What matters is not guessing the winner, but building a portfolio you can hold for the long term and investing regularly.

Frequently asked questions
What is the difference between the MSCI World and the S&P 500?
The S&P 500 groups 500 large American companies. The MSCI World counts about 1,500, spread across 23 developed countries, but still stays 70% American stocks. The S&P 500 is more concentrated and historically higher-performing; the MSCI World is more geographically diversified.
Is the MSCI World really diversified?
Partly. It covers 23 developed countries, but 70% of its composition stays American, and both China and India are absent from it. Its correlation with the S&P 500 reaches 0.98: the two indices move in almost the same way.
Can you hold the MSCI World and the S&P 500 in a PEA?
Yes, PEA-eligible ETFs exist for both indices, with fees ranging between 0.12% and 0.38% a year depending on the product. However, no MSCI ACWI ETF (which includes emerging countries) is PEA-eligible.
Should you choose the MSCI World or the S&P 500?
It all depends on your bet on the United States. If you think it will keep dominating, the S&P 500 offers maximum exposure to today's leaders. Otherwise, the MSCI World spreads the risk. Many investors hold both so they do not have to choose.
Is the S&P 500 riskier than the MSCI World?
It is more concentrated: its top 10 holdings weigh 40% of the index, mostly technology giants. The MSCI World dilutes this further (28%). But the 0.98 correlation between the two limits the real difference in risk. Past performance is not a reliable indicator of future performance.
Sources
Investopedia - S&P 500 average annual return
Curvo - MSCI World vs S&P 500 backtest for the European investor
Economic Times - record concentration of the S&P 500
Amundi - PEA S&P 500 ETF (0.12% fees)
Vanguard - long-term diversification and currency risk
Regulatory disclaimers: Marketing communication. Investing carries a risk of partial or total capital loss. Past performance is not a reliable indicator of future performance. This article is provided for information and educational purposes only; it does not constitute personalised investment advice, a buy or sell recommendation, or tax advice. Before investing, read the Key Information Document (KID) and, where relevant, consult an authorised adviser. Finary SAS, an investment firm authorised by the ACPR under no. 19283, member of AMAFI. Insurance broker registered with ORIAS under no. 21001279, member of the CNCGP (association approved by the AMF). Crypto-Asset Service Provider (CASP) authorised by the AMF under the MiCA regime, references no. A2026-026 and no. N2026-008.